
Heart rate variability (HRV): different measurements and their interpretation
HRV analysis measures the time intervals from heartbeat to heartbeat (RR intervals) in milliseconds. The more variable the intervals, the more dominant the parasympathetic nervous system (relaxation and recovery). In this way, it is possible to determine the current state of stress or relaxation of the autonomic nervous system. In a rest measurement and in a relaxed atmosphere, the RI index (rest index) should be more dominant than the SI index (stress, tension).
What do my readings mean?
Very good balance between tension and relaxation
All measured values are in the middle green normal range, whereby the parasympathetic nervous system (RI index) is slightly higher than the sympathetic nervous system (SI index) – an optimal regulation and balance between tension and relaxation. The very good variability is shown in the rhythmogram: The 7 bars next to each other in the histogram and a wide cloud of dots in the scatter diagram show that in a rest situation the parasympathetic nervous system is dominant.


Good balance between sympathetic and parasympathetic nervous system
A good balance between the sympathetic and parasympathetic nervous system: All values are in the green normal range and a good variability is visible in the rhythmogram. 6 bars next to each other in the histogram and a wide point cloud make the good variability visible.


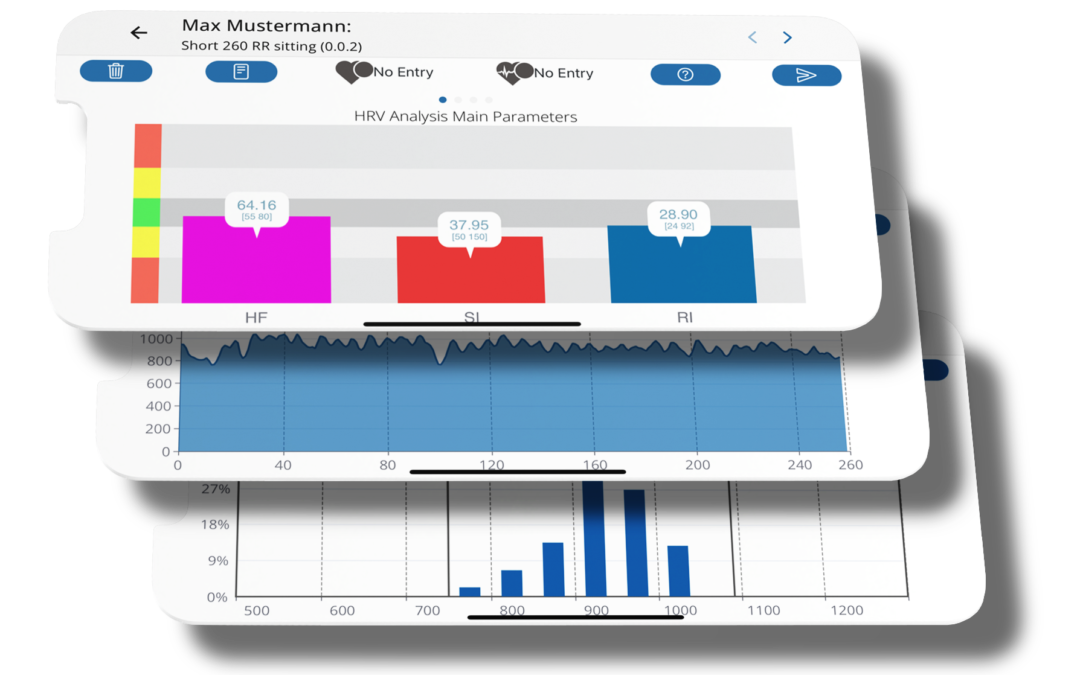
Mild to moderate stress
The stress/tension (SI) and recovery/regeneration (RI) readings are outside the green normal range and indicate a mild to moderate stress situation. At rest, the parasympathetic nervous system cannot be activated enough so that the entire body is still in stress regulation. The variability in the rhythmogram is less pronounced, and 5 bars in the histogram indicate an incipient permanent stress if sufficient relaxation is not provided.


Severe stress / Medium-term stress
The readings for SI and RI show that this is not short-term stress, but rather medium- and long-term stress. The causes should be clarified here. What is constantly stressing the overall organism? What life circumstances and events have triggered this? Any therapy, change in life circumstances or decision should lead to a better relationship between SI and RI. The well-known saying: “Better an end with horror than horror without an end” should provide a suggestion here.


Massive stress / permanent stress
With such high SI levels, measures such as relaxation therapies and procedures should be taken urgently to reduce stress levels. However, before change and therapy, the causes should be found out and then workable solutions with realistic goals should be sought. No matter what is done as an intervention, the measures should bring the RI (parasympathetic nervous system) up and the SI value down step by step.


Athlete – very good variability
Athletes are very good at switching between tension and relaxation. Through years of training and 2-3 training sessions a day, the body adapts so well that a very large variability can be seen in an HRV analysis. The resting pulse of well-trained endurance athletes can be in the range of 38 – 45 beats per minute. Up to 14 bars are possible in the histogram and a very wide scatter plot.


