
Heart rate variability (HRV): Measurements while taking beta blockers, with and without error correction, non-evaluable measurements
HRV analysis measures the time intervals from heartbeat to heartbeat (RR intervals) in milliseconds. The more variable the intervals, the more dominant the parasympathetic nervous system (relaxation and recovery). Extreme measurements occur under different circumstances, learn how to interpret this data here.
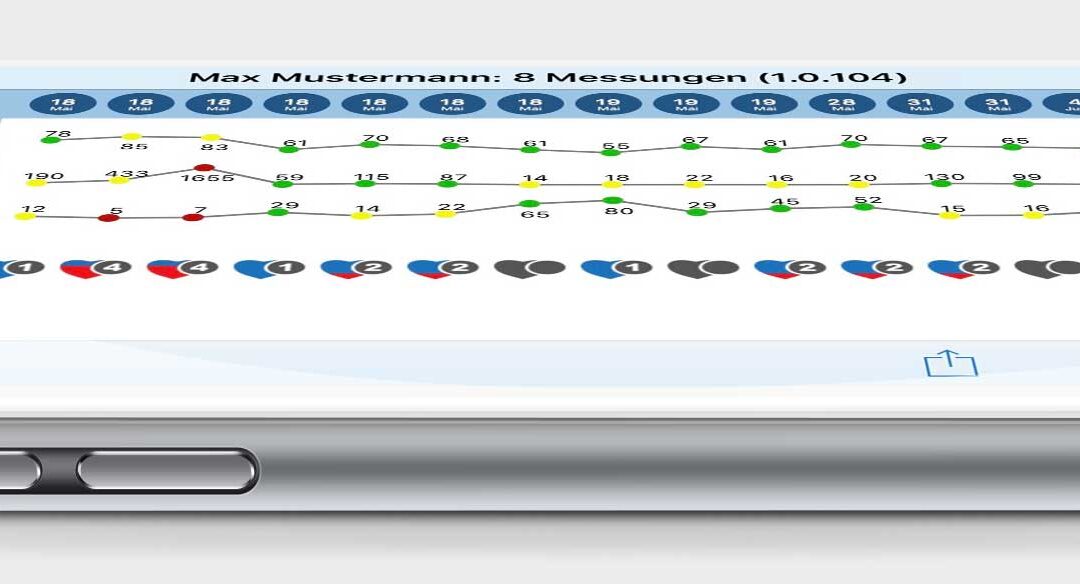
What do my readings mean?
Beta blockers – overdose immediately recognizable
Basically, all drugs have an effect on the sympathetic and parasympathetic nervous system, either inhibiting or activating it. Beta blockers and other drugs to reduce blood pressure and heart rate are very often prescribed and should be taken for life. We cannot understand such unbiological recommendations, and they usually lead to a longer suffering. HRV analysis can quickly reveal whether the recommended medication is correct, too high or too low a dosage. In this example, the beta blockers were clearly dosed too high, the patient complained of constant fatigue, listlessness and lack of energy.


Measurement without automatic error correction
Artefacts and measurement errors can strongly influence the calculation of the values of SI and RI. Very strong deflections (peak) upwards and downwards are evaluated by the calculation (without error correction) as large variability. This example shows a measurement with a high stress index and hardly any variability (flat rhythmogram). In the calculation, this one peak/artefact reduces the actual SI index from 872 to 306. And erroneously increases the RI index from 5.3 to 15.8. The automatic error correction works in the background and prevents the erroneous evaluation within a certain mathematical range. Nevertheless, the rhythmogram should always be looked at in order to detect measurement errors, artefacts. To evaluate the pure measured values without rhythmogram and histogram would be a source of error.


Measurement with automatic error correction
The previous representation without error correction is shown as clearly “better” in comparison. With correction of the artefacts by the internal error correction, the SI and RI values indicate significantly more stress/continuous stress. The goal of a good holistic therapy should be to strengthen the parasympathetic nervous system (more relaxation/recovery) and to reduce the sympathetic nervous system, so that the two bars move towards the green normal range.


Measurement not evaluable
When looking only at the three main parameters HF, SI and RI, these values would all be within the normal range. However, a look at all other graphs (rhythmogram, histogram and scatter plot) shows that this measurement cannot be calculated correctly. In the rhythmogram, some peaks (artefacts) can be seen that make the mathematical calculation of the values impossible. By mentally “deleting” the peaks and looking at the characteristics of the rhythmogram, it is nevertheless possible to see what the state of the VNS is, i.e. the stress state. After further measurements over the course of days or after therapeutic interventions, it will become apparent whether the picture in the rhythmogram is changing – with fewer and fewer peaks and more variability. Thus, even with measurements where the values are not correctly displayed, a good assessment can be made.


